Introduction of the data
This dataset contains exam marks of the course “STAT2001 Probability and Inference” at UCL. The data are recorded by 8 exam question.
First let’s take a look to some summary statistics to better understand the data:
| Overall (N=150) | |
|---|---|
| A1 = Basic Probability | |
| Mean (SD) | 15.45 (2.79) |
| Median (Range) | 16.00 (0.00, 18.00) |
| A2 = 2-Dim Densities | |
| Mean (SD) | 5.29 (2.27) |
| Median (Range) | 5.00 (0.00, 10.00) |
| A3 = Distributions derived from Norm. Distrib. | |
| Mean (SD) | 4.25 (2.05) |
| Median (Range) | 5.00 (0.00, 6.00) |
| A4 = Central Limit Theorem & approx. | |
| Mean (SD) | 3.95 (1.49) |
| Median (Range) | 4.00 (0.00, 6.00) |
| B1 = Moment-generating functions | |
| Mean (SD) | 9.20 (2.98) |
| Median (Range) | 11.00 (0.00, 11.00) |
| B2 = Joint,Marginal,Conditional distrib. | |
| Mean (SD) | 12.03 (6.35) |
| Median (Range) | 13.00 (0.00, 23.00) |
| B3 = Multivariate normal distribution | |
| Mean (SD) | 7.93 (4.43) |
| Median (Range) | 8.00 (0.00, 15.00) |
| B4 = Estimation theory | |
| Mean (SD) | 6.25 (4.10) |
| Median (Range) | 7.00 (0.00, 11.00) |
The major interest in about these exam marks is whether the questions all measure the same skill, i.e., how strongly the results in the different questions are related to each other, and whether one could basically explain this as one “basic skill plus noise”, or whether different questions measure essentially different skills.
Before starting I had to standardize the marks as questions A take lower score than questions B in the final average.
Now let’s visualize the data to start understanding
Visualization
boxplot(examcore,
        horizontal = TRUE,
        col="light blue",
        notch = F,
        col.axis = "blue",
        medcol= "blue")
title("Boxplot")
#if the notches don't overlap there is a strong evidence that the medians differsWe plot the data in order to see if there is correlation between the different questions. As we can see in the graph below there does not seem to be any particular path except for the questions B2,B3,B4 (respectively on “joint, marginal and conditional distribution” and on “multivariatenormal distribution”), which seem to be correlated.
So probably students who did well on question “B” were those better prepared for the exam, as they did well in these questions (the most difficult).
library("GGally")
scatterplot <- ggpairs(examcore,
                       title = "Scatterplot Matrix",
                       aes(color = "blue"))
scatterplot
***
# Statistical Analysis
I’m going to perform Principal Component Analysis in order to see if different questions “measure” different skills. What came out is that only first principal component has loadings for all of the variables (i.e. the questions).
Anyway, first two component just explains 67% of the variability (I just consider two principal components since the line gets flat after second component).
library(FactoMineR)
pca <-PCA(examcore, graph = F)

# barplot(pca$eig[,2], names.arg=1:nrow(pca$eig),
#        main = "Variances",
#        xlab = "Principal Components",
#        ylab = "% of Variances",
#        col ="orange")
# lines(x = 1:nrow(pca$eig), pca$eig[, 2],
#       type="b", pch=19, col = "black")

library(factoextra)
## Welcome! Want to learn more? See two factoextra-related books at https://goo.gl/ve3WBafviz_screeplot(pca, ncp=8,
barcolor = "yellow",
barfill = "orange",
linecolor = "black",
addlabels = T)
The loadings of the first two principal component did not show any particular characteristics or higher value compared to the rest, so I guessed that the questions only measure one basic skill and not different skills. In general all B questions have higher values, and since we know B questions are more difficult than A ones, this suggest this component measures the preparation level of a student for the exam.
PCA <- princomp(examcore)
PCA$loadings
##
## Loadings:
## Comp.1 Comp.2 Comp.3 Comp.4 Comp.5 Comp.6 Comp.7 Comp.8
## A1 0.132 0.110 0.159 0.186 0.105 0.948
## A2 0.203 0.348 0.389 -0.750 0.161 -0.263 -0.161
## A3 0.448 -0.597 0.494 0.333 0.154 -0.210 -0.142
## A4 0.323 0.136 0.105 0.110 -0.139 -0.674 0.615
## B1 0.290 0.406 -0.814 -0.275
## B2 0.378 0.255 0.265 0.656 0.503 -0.176
## B3 0.379 0.553 0.477 -0.264 -0.496
## B4 0.515 -0.346 -0.742 -0.145 -0.143 0.125
##
## Comp.1 Comp.2 Comp.3 Comp.4 Comp.5 Comp.6 Comp.7 Comp.8
## SS loadings 1.000 1.000 1.000 1.000 1.000 1.000 1.000 1.000
## Proportion Var 0.125 0.125 0.125 0.125 0.125 0.125 0.125 0.125
## Cumulative Var 0.125 0.250 0.375 0.500 0.625 0.750 0.875 1.000Variable contributions in the determination of a given principal component are:
fviz_pca_var(pca, col.var="contrib", repel = T) +
  scale_color_gradient2(low="blue", mid="yellow", high="red",
                        midpoint=12.5) +
     theme_bw()
it emerges that B3,B4 contributes altogether, and it appears that B2 has a strong influence on the 1st component, again suggesting that the B questions were influential in explaining the correlation among the questions of the exam
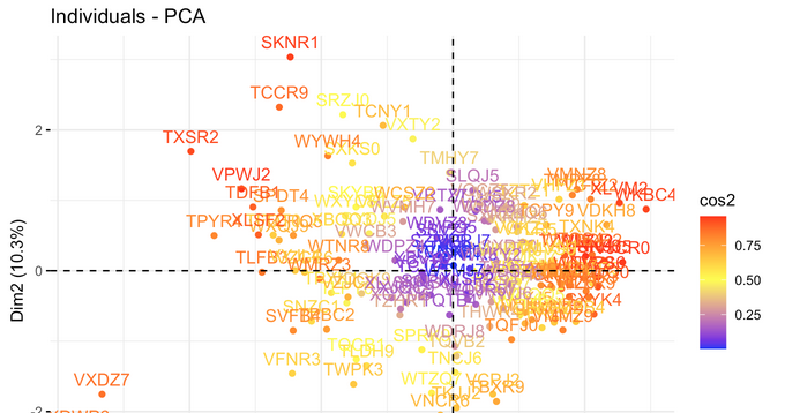
The quality of representation of the variables of the principal components are called the cos2.
fviz_pca_ind(pca, col.ind="cos2",
             repel = F) + #avoid text overlapping
scale_color_gradient2(low="blue", mid="yellow", high="red",
                      midpoint=0.5)
In the first plot below it can be seen that there are three observations which are outliers (VXDZ7,XDWP6,TWFC1), which got really bad marks
Conclusion
After visualizing the data and performing PCA, it was possible to affirm that the main skill beneath the exam marks was the “level of preparation for the exam”. It was not clear whether different questions measure different skills, the correlations underlined the level of difficulty
References
Heinzen, Ethan et al. 2021. Arsenal: An arsenal of r functions for large-scale statistical summaries. https://CRAN.R-project.org/package=arsenal.
Husson, Francois et al. 2020. FactoMineR: Multivariate exploratory data analysis and data mining. http://factominer.free.fr.
Lê, Sébastien, Julie Josse, and François Husson. 2008. “FactoMineR: A package for multivariate analysis.” Journal of Statistical Software 25(1): 1–18.
Schloerke, Barret et al. 2021. GGally: Extension to ggplot2. https://CRAN.R-project.org/package=GGally.
